
Page 33 - The police annual report 2016
annual report 2016
P. 33
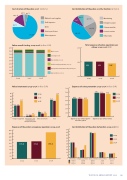
Cost structure of the police 2016 (all items) 2,6% 4,1%
Cost distribution of the police 2016 by function (all items)
14,2 %
8,2 %
Materials and supplies Staff expenses
Rents
Service purchases Other expenses
8,2 %
8,9 %
43,3 %
200
150
100
17,7 %
21,8 %
Monitoring Emergency operations Crime prevention Licence services
Other tasks
900
800
700
600
500
400
300
200
100
0
16 14 12 10
8 6 4 2 0
180
160
140
120
100
80 60 40 20
0
Other income
Licensing income
Kejo mandate 26.10.21
Variable annual appropriations 26.10.20 Appropriations transferred from the previous year Appropriations 26.10.01
70,9 %
Police overall funding 2014–2016 (million EUR)
Total expenses of police operations per citizen 2014–2016 (EUR)
151
151
145
2014
2015
2016
2014 2015 2016
Police investments 2014–2016 (million EUR) 2014
700 600
Expenses of crime prevention 2014–2016 (million EUR)
communications equipment/systems
Expenses of the police's emergency operations 2014–2016
Cost distribution of the police by function 2014-2016 (%) 2014
14,8
581
570 554 2014
10,7
Transport equipment
7,5 7,6
300 200 100
0,7 0,9 1,6
2015 2016
3,2 2,1 2,5
Other investments
500 443 11,4 10,6 400
437
425
2015 2016
Information and
Total
0 Expenses per crime report- ed to the police
Expenses per solved crime
105.4
109.1
165.5
2014
2015
2016
50
45
40
35
30
25
20
15
10
5
0 Monitoring 26,4 % 26,5 % 17,7 %
Emergency operations 13,4 %
13,9 % 21,8 %
Crime prevention 43,8 %
42,8 % 43,3 %
Licence services 9,4 %
9,7 %
8,9 %
2015 2016
Other tasks 7,1 % 7,1 % 8,2 %
THE POLICE, ANNUAL REPORT 2016 33
