
Page 9 - The police annual report 2016
annual report 2016
P. 9
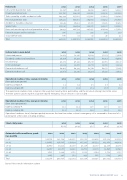
Police tasks
2012
2013
2014
2015
2016
Life and limb protection tasks
52,198
54,540
54,390
54,462
54,523
Property protection tasks
111,720
114,318
116,016
112,536
105,630
Tasks caused by a traf c accident or traf c
249,194
257,607
275,816
272,813
274,648
Personal protection tasks
298,429
300,361
284,699
273,452
269,856
Accident or hazardous situation
33,149
38,913
37,730
37,901
36,462
Special tasks
155,330
139,834
130,376
130,127
128,822
Basic and monitoring tasks and preventive actions
94,493
102,794
147,475
160,204
177,861
Patient transport and  rst aid tasks
306
323
293
269
277
Social welfare tasks
686
93
90
46
41
Total
995,505
1,008,783
1,046,885
1,041,810
1,048,120
Certain tasks in more detail
2012
2013
2014
2015
2016
Intoxicated person
71,473
71,136
63,819
57,273
53,880
Disorderly conduct and vandalism
98,908
96,497
88,383
85,053
84,881
Drunk driving
45,231
46,141
46,210
42,355
40,172
Criminal damage
15,539
15,266
13,773
13,160
11,114
Domestic disturbance call
84,405
84,319
81,780
80,177
77,085
Domestic violence call
23,565
25,275
25,237
26,223
25,821
Operational readiness time, average in minutes
(from police perspective)
2012
2013
2014
2015
2016
Urgency category A
9.2
9.4
9.5
9.3
9.4
Urgency category AB
16.7
17.4
17.9
17.8
17.9
The operational readiness time comprises the assignment waiting time, patrol delay, and the minimum driving time to the scene. The time spent in processing the assignment by the emergency rescue services is not included.
Operational readiness time, average in minutes
(from client perspective)
2012
2013
2014
2015
2016
Urgency category A
12.2
12.4
12.6
12.3
12.3
Urgency category AB
21.3
22.2
23.0
22.9
23.2
Operational readiness time (client perspective) measures the time from when a citizen's emergency call is answered to the arrival of a police patrol at the scene, including all delays.
Street safety index
2012
2013
2014
2015
2016
85.83
92.43
97.5
98.4
99.74
Automatic traf c surveillance, speed- ing, quantity
2010
2011
2012
2013
2014
2015
2016
6-10
198,706
191,734
142,356
131,562
121,400
218,129
323,059
11-15
131,885
138,226
132,294
127,315
136,539
123,261
143,221
16-20
45,880
50,429
45,138
45,198
49,707
44,108
49,963
21-30
19,587
22,567
19,955
19,875
23,170
19,846
20,647
31-40
1,825
1,994
1,762
1,613
2,064
1,759
1,797
41-
1,285
946
569
435
666
629
920
Total
399,168
405,896
342,074
325,998
333,546
407,732
539,607
Source: Police results information system
THE POLICE, ANNUAL REPORT 2016 9
