
Page 128 - Työpoliittinen aikakauskirja 1 2018
P. 128
Taulukot
Työpoliittinen aikakauskirja 1/2018
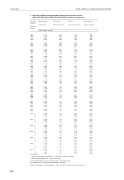
5. TYÖLLISET TOIMIALOITTAIN, MOLEMMAT SUKUPUOLET (Supistettu luokitus)
EMPLOYED PERSONS BY INDUSTRY, BOTH SEXES (Condensed classifications)
Vuosi ja neljännes
Year and quarter
Kaikki toimialat 1 All industries 1
1 000 henkilöä - persons 2 159
2 215 2 215 2 265 2 326 2 312
2 278 2 232 2 200 2 256 2 328
2 353 2 377 2 390 2 413 2 437
2 431 2 423 2 431 2 507 2 504
2 375 2 206 2 071 2 054 2 099
2 127 2 170 2 222 2 296 2 335
2 367 2 372 2 365 2 365 2 401
2 444 2 492 2 531 2 457 2 447
2 474 2 483 2 457 2 447 2 437
2 448 2 473
2 408 2 517 2 514 2 456
2 432 2 524 2 529 2 448
2 408 2 506 2 490 2 422
2 394 2 490 2 487 2 418
2 391 2 463 2 481 2 412
2 396 2 477 2 493 2 427
2 407 2 494 2 506 2 486
Alkutuotanto
Primary industries
Jalostus
Secondary industries
Palveluelinkeinot
Tertiary industries
811 822 836 864 928
982 1 041 1 079 1 104
1 109 1113 1 121 1 159 1 201
1 221 1 258 1 295 1 335 1 378
1 388 1 417 1 450 1 512 1 522
1 481 1 403 1 334 1 333 1 351
1 383 1 417 1 457 1 509 1 544
1 583 1 599 1 616 1 635 1 675
1 714 1 746 1 771 1 748 1 762
1 792 1 805 1 784 1 798 1 798
1 804 1 828
1 755 1 827 1 805 1 783
1 775 1 836 1 833 1 781
1 756 1 817 1 806 1 766
1 759 1 832 1 823 1 786
1 775 1 813 1 825 1 780
1 784 1 817 1 834 1 786
1 800 1 846 1 832 1 838
1966 1967 1968 1969 1970 2
1971 1972 1973 1974 1975
1976 1977 1978 1979 1980
1981 1982 1983 1984 1985
1986 1987 1988 1989 2 1990
1991 1992 1993 1994 1995
1996 1997 1998 1999 2000
2001 2002 2003 2004 2005
2006 2007 2008 2009 2010
2011 2012 2013 2014 2015
2016 2017
2011 2012 2013 2014 2015 2016 2017
2114 2 073 2 097 2 217
623 725 567 725 532 705 505 728 538 752
508 765 461 772 432 793 424 822 391 812
367 790 336 775 316 757 309 779 314 803
305 821 312 801 302 789 293 784 279 776
266 774 251 753 238 741 233 760 222 757
210 681 197 603 183 548 178 536 170 572
159 579 153 594 144 613 144 637 144 642
135 642 127 639 120 620 116 606 121 599
118 607 118 621 119 628 119 581 115 560
110 560 109 557 107 553 109 528 109 520
101 534 99 542
110 534 112 567 114 583 106 556
104 543 111 568 116 568 106 550
100 541 115 565 111 561 104 544
105 519 111 538 115 536 106 518
105 502 118 520 110 540 103 520
97 507 109 542 106 543 91 544
92 510 101 545 105 565 96 546
942
I II III IV
I II III IV
I II III IV
I II III IV
I II III IV
I II III IV
I II III IV
22*
1. Ryhmä "tuntematon" mukaanlukien. - Including the category "unknown". 2. Katso alaviite taulukkoon 2. - See note to table 2.
Vuodesta 2005 lähtien uuden toimialaluokituksen TOL2008 mukaan -
From 2005 based on new industrial classification TOL2008
Lähde: Tilastokeskus, Työvoimatutkimus - Source: Statistics Finland, Labour Force Survey
