
Page 132 - Työpoliittinen aikakauskirja 1 2018
P. 132
Taulukot
Työpoliittinen aikakauskirja 1/2018
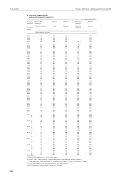
8. TYÖLLISET TOIMIALOITTAIN
EMPLOYED PERSONS BY INDUSTRY
Jatkoa -Continued Palvelut
Services
Vuosi ja neljännes
Year and quarter
Maa- ja vesi- rakennus
Other construction
1 000 henkilöä - persons
Kauppa
Trade
Liikenne Rahoitus- ja vakuutus
Transport Financing, insurance
1966 1967 1968 1969 1 1970
1971 1972 1973 1974 1975
1976 1977 1978 1979 1980
1981 1982 1983 1984 1985
1986 1987 1988 1989 1 1990
1991 1992 1993 1994 1995
1996 1997 1998 1999 2000
2001 2002 2003 2004 2005
2006 2007 2008 2009 2010
2011 2012 2013 2014 2015
2016 2017
2011 2012 2013 2014 2015 2016 2017
72 300 74 303 72 306 67 305
58 294
53 298 54 305 54 326 56 334 58 329
57 333 54 320 52 313 53 318 48 328
51 326 50 326 43 337 40 343 41 355
43 355 41 348 43 354 42 388 39 395
39 364 36 325 33 305 28 297 28 301
30 316 29 329 32 339 32 355 27 354
30 357 31 363 33 362 33 367 18 373
18 376 19 389 21 399 23 381 20 381
19 386 20 386 20 382 19 376 17 371
15 375 20 367
17 368 18 401 21 395 20 379
18 362 20 400 23 401 22 382
18 377 19 405 21 387 21 362
17 363 22 392 21 393 18 357
17 361 20 383 18 379 15 361
13 359 18 385 16 396 16 363
18 356 20 377 22 373 21 360
2
143 .. 369 140 .. 379 141 .. 389 146 .. 2 412 165 84 385
160 84 400 166 90 421 167 99 449 170 109 466 177 118 480
173 117 486 170 117 506 174 117 517 179 120 542 184 127 562
184 130 581 180 136 616 177 135 646 180 148 664 186 156 681
183 160 690 182 177 710 182 190 724 178 262 684 179 268 681
175 263 679 165 250 663 158 234 637 161 230 645 163 228 659
159 241 667 164 240 685 169 249 700 168 267 719 172 287 732
174 301 750 169 308 758 173 313 767 172 315 781 144 384 774
154 399 785 151 414 792 153 419 800 153 408 806 156 416 809
147 427 832 144 436 839 142 431 830 140 444 839 137 457 834
141 448 841 139 471 853
149 416 822 151 433 843 146 430 834 144 433 828
145 433 834 141 444 851 150 442 840 140 429 830
140 421 818 143 437 832 148 430 841 139 438 826
135 433 828 146 448 846 140 446 844 140 447 842
131 449 834 136 463 832 140 466 840 141 447 830
143 449 833 144 449 839 139 446 853 137 446 840
136 465 843 138 475 856 142 472 846 143 466 871
26*
I II III IV
I II III IV
I II III IV
I II III IV
I II III IV
I II III IV
I II III IV
1. Katso alaviite taulukkoon 2. - See note to table 2.
2. Vuosina 1961 - 1969 "rahoitus- ja vakuutustoiminnan" luvut sisältyvät "kaupan" lukuihin. -
In the years 1961 - 1969 the figures for "financing and insurance" include in the figures for "trade".
Vuodesta 2005 lähtien uuden toimialaluokituksen TOL2008 mukaan -
From 2005 based on new industrial classification TOL2008
