
Page 130 - Työpoliittinen aikakauskirja 2 2018
P. 130
Taulukot
Työpoliittinen aikakauskirja 2/2018
42*
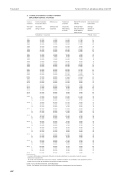
20. TYÖNVÄLITYSTOIMINTA: AVOIMET TYÖPAIKAT
EMPLOYMENT SERVICE: VACANCIES
Vuosi ja neljännes
Year and quarter
1981 1982 1983 1984 1985
1986 1987 1988 1989 1990
1991 1992 1993 1994 1995
1996 1997 1998 1999 2000
2001 2002 2003 2004 2005
Avoimet työpaikat kuukauden aikana
Vacancies during a month
Näistä uusia
Of these new vacancies
17 200 16 400 16 900 16 900 16 700
14 100 16 200 22 500 27 500 24 400
15 000 10 000 8 900 12 100 13 200
15 000 18 900 19 900 20 900 24 100
25 300 26 000 26 600 27 400 32 900
Täyttyneet työpaikat
Vacancies filled during a month
17 100 16 200 16 400 16 500 16 600
13 700 15 500 19 100 23 900 22 500
Näistä TE-toimiston hakijalla
Of these filled with job-seekers at the Employ- ment service
Avoinnaolon kesto keskimäärin
Average duration of vacancy
Päivää
2008 2009 2010
79 800 58 400 64 200
45 200 33 900 38 400
9 900 8 600
24 23 21
2011 2012 2013 2014 2015
2016 2017
2009 I II
2010 I II
2011 I II
2012 I II
2013 I II
2014 I II
2015 I II
2016 I II
2017 I II
2018 I
78 000 76 200 71 200 72 100 76 300
84 700 93 200
78 400 63 700 47 300 44 300
74 900 68 900 58 000 55 200
98 300 85 500 66 700 61 300
103 400 85 300 61 100 54 800
96 000 77 800 56 700 54 200
94 700 74 800 60 900 58 100
96 900 81 700 64 700 62 100
98 500 91 600 77 500 71 300
108 200 94 900 85 100 84 500
131 200
45 200 42 900 39 200 38 900 41 000
46 800 49 300
45 700 34 200 28 700 26 900
46 300 37 000 36 400 33 800
57 800 45 800 40 900 36 200
58 800 44 500 36 400 31 800
53 300 39 200 33 500 30 600
51 300 37 100 35 200 32 100
53 900 39 000 36 000 35 000
54 600 49 200 44 700 38 600
58 500 47 500 46 700 44 700
69 100
15 300 17 400 11 600
7 900 7 000 4 300 6 000 6 100
4 600 5 100
11 700 13 600 8 600 5 700
8 500 11 500 8 200 6 500
8 200 10 800 7 200 5 600
7 500 9 700 6 100 4 600
5 200 5 600 3 700 2 700
4 700 6 300 6 100 6 800
7 100 8 000 4 900 4 400
5 000 5 700 4 200 3 600
5 000 5 900 4 900 4 400
4 800
22 24 24 26 29
26 28
24 23 21 22
21 23 20 19
22 25 21 20
23 26 23 21
24 27 23 22
25 30 24 23
26 32 27 32
26 27 25 26
29 28 28 27
30
III IV
8 600
III IV
12 100 15 300 11 900
III IV
11 600 15 500 11 200
III IV
12 100 14 500 9 500 7 400
9 300 10 300 7 400 6 100
8 100 9 600 9 400 8 800
11 500 14 000 9 700 8 600
9 700 11 300 9 500 7 800
9 100 9 900 8 500 8 300
8 800
III IV
III IV
III IV
III IV
III IV
Työpaikkaa - Vacancies 30 900
11 400 11 100 11 300 11 400 11 600
9 000 10 100 10 900 11 800 10 500
7 400 5 400 4 600 6 300 7 000
- Days 21
27 600 28 400 28 700 28 900
26 000 28 300 37 200 56 000 51 000
27 800 16 500 14 200 18 300 20 400
23 800 30 400 35 000 34 500 39 500
43 400 45 800 48 800 48 800 59 900
19 18 18 20
14 200 9 500 8 300
23 21 20 27 30
22 16 17 16 16
17 18 21 19 20
21 22 24 24 24
11 100 12 400
14 100 17 700 18 900 20 000 23 200
24 600 25 200 25 900 26 300 31 300
17 400 22 600 20 900 13 200 12 200
12 000 10 900 8 300 9 000 11 000
9 600 8 900
8 300
9 500
9 800
9 900 10 300 10 800 11 900
12 300 12 100 12 100 11 200 12 600
2006 2007
70 500 82 700
38 900 44 900
1
13 200 17 300 16 000
1
25 25
1 Vuodesta 2006 alkaen ehdokkaita riittävästi ja hakuaika päättynyt muutossyitä ei lasketa mukaan täyttyneisiin työpaikkoihin.
1 Asofthestartof2006tworeasonsforchange,'sufficientnumbersofcandidates'and'applicationperiod ended', will no longer be included in the figures for filled vacancies.
Lähde: Työ- ja elinkeinoministeriö, Työnvälitystilasto
Source: The Ministry of Economic Affairs and Employment, Employment Service Statistics
