
Page 97 - Työpoliittinen aikakauskirja 2 2018
P. 97
Työpoliittinen aikakauskirja 2/2018
Kuviot
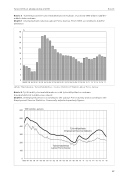
Kuvio 7. Työttömyysasteet työvoimatutkimuksen mukaan. Vuodesta 1989 alkaen ILO/EU- määritelmän mukaan
Chart 7. Unemployment rates by Labour Force Survey. From 1989, according to ILO/EU definition
18 % 1618 1416 1214 1012
810 68 46 24
02
1986'87 '88 '89 '90 '91 '92 '93 '94 '95 '96 '97 '98 '99 '00 '01 '02 '03 '04 '05 '06 '07 '08 '09 '10 '11 '12 '13 '14 '15 '16 '17
%
0
Lähde: Tilastokeskus, Työvoimatutkimus - Source: Statistics Finland, Labour Force Survey
1986'87 '88 '89 '90 '91 '92 '93 '94 '95 '96 '97 '98 '99 '00 '01 '02 '03 '04 '05 '06 '07 '08 '09 '10 '11 '12 '13 '14 '15 '16 '17
Kuvio 7. Työttömyysasteet työvoimatutkimuksen mukaan. Vuodesta 1989 alkaen ILO/EU-määritelmän mukaan
Kuvio 8. Työttömät työvoimatutkimuksen sekä työnvälitystilaston mukaan.
Kuvio 7. Työttömyysasteet työvoimatutkimuksen mukaan. Vuodesta 1989 alkaen
Chart 7. Unemployment rates by Labour Force Survey. From 1989, according to ILO/EU
Kausipuhdistetut neljännesvuosiluvut
ILO/EU-määritelmän mukaan
definition
Chart 8. Unemployed persons according to the Labour Force Survey and according to the Lähde: Tilastokeskus, Työvoimatutkimus - Source: Statistics Finland, Labour Force Survey
Chart 7. Unemployment rates by Labour Force Survey. From 1989, according to ILO/EU
Employment Service Statistics. Seasonally adjusted quarterly figures
'000 henkilöä - persons
definition
600 5
4
3
2 1
Lähde: Tilastokeskus, Työvoimatutkimus - Source: Statistics Finland, Labour Force Survey
600
00
500
00
400
00
300
00
200
00
100
0 1993
'000 henkilöä - persons
E
mpl
Ty
oy
önv
ent
älit
Se
stil
rvic
asto
e St
atis
tics
Työnvälitystilasto
Employment Service Statistics
Työ
voi
mat
utki
mus
Työvoimatutkimus
Labour Force Survey
'94
'95
'96
'97
'98
'99
'00
'01
'02
'03
'04
'05
'06
'07
'08
'09
'10
'11
'12
'13
'14
'15
'16
'17
'18
y
m
Labour Force Survey
0
1993'94 '95 '96 '97 '98 '99 '00 '01 '02 '03 '04 '05 '06 '07 '08 '09 '10 '11 '12 '13 '14 '15 '16 '17 '18
Kuvio 8. Työttömät työvoimatutkimuksen sekä työnvälitystilaston mukaan. Kausipuhdistetut neljännesvuosiluvut
Kuvio 8. Työttömät työvoimatutkimuksen sekä työnvälitystilaston mukaan.
Chart 8. Unemployed persons according to the Labour Force Survey and according
Kausipuhdistetut neljännesvuosiluvut
to the Employment Service Statistics. Seasonally adjusted quarterly figures
9*
Chart 8. Unemployed persons according to the Labour Force Survey and according to the Employment Service Statistics. Seasonally adjusted quarterly figures
