
Page 80 - Työpoliittinen aikakauskirja 4 2017
P. 80
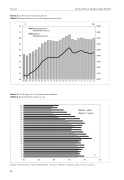
Kuvio 3. Työlliset ja työllisyysasteetChart 3. Employed persons and employment ratesKuvio 4. Työllisyysasteet sukupuolen mukaan Chart 4. Employment rates by sexLähde: Tilastokeskus, Työvoimatutkimus - Source: Statistics Finland, Labour Force Survey oyed personsKuvio 3. Työlliset ja työllisyysasteetChart 3. Employed persons and employment rateKuvio 4. Työllisyysasteet sukupuolen mukaanChart 4. Employment rates by sexLähde: Tilastokeskus, Työvoimatutkimus - Source: Statistics Finland, Labour Force Survey2000210022002300240025002600270028002900485154576063666972751993'94'95'96'97'98'99'00'01'02'03'04'05'06'07'08'09'10'11'12'13'14'15'16Työllisyysaste (%)Employment rate (%)TyöllisetEmployed persons% '000 5055606570751993'94'95'96'97'98'99'00'01'02'03'04'05'06'07'08'09'10'11'12'13'14'15'16Miehet - MalesNaiset - Females% oyed personsKuvio 3. Työlliset ja työllisyysasteetChart 3. Employed persons and employment rateKuvio 4. Työllisyysasteet sukupuolen mukaanChart 4. Employment rates by sexLähde: Tilastokeskus, Työvoimatutkimus - Source: Statistics Finland, Labour Force Survey2000210022002300240025002600270028002900485154576063666972751993'94'95'96'97'98'99'00'01'02'03'04'05'06'07'08'09'10'11'12'13'14'15'16Työllisyysaste (%)Employment rate (%)TyöllisetEmployed persons% '000 5055606570751993'94'95'96'97'98'99'00'01'02'03'04'05'06'07'08'09'10'11'12'13'14'15'16Miehet - MalesNaiset - Females%
