
Page 92 - 4 2018
P. 92
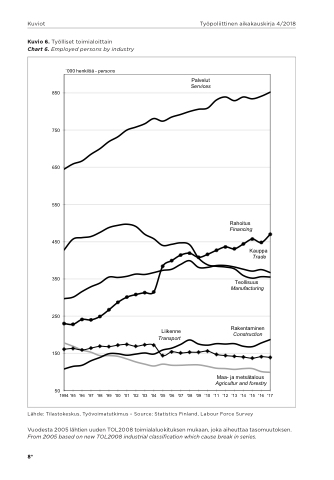
Kuviot Työpoliittinen aikakauskirja 4/2018 Kuvio 6. Työlliset toimialoittain
Chart 6. Employed persons by industry
   `000 henkilöä - persons 850
750
650
550
450
350
250
150
50
1994 '95 '96 '97 '98 '99 '00 '01 '02 '03 '04 '05 '06 '07 '08 '09 '10 '11 '12 '13 '14 '15 '16 '17
Palvelut
Services
    Rahoitus
Financing
    Kauppa
Trade
        T eollisuus
Manufacturing
           Liikenne
Transport
Rakentaminen
Construction
                     Maa- ja metsätalous
Agricultur and forestry
                                                  Lähde: Tilastokeskus, Työvoimatutkimus – Source: Statistics Finland, Labour Force Survey
Vuodesta 2005 lähtien uuden TOL2008 toimialaluokituksen mukaan, joka aiheuttaa tasomuutoksen.
From 2005 based on new TOL2008 industrial classification which cause break in series.
8*
