
Page 93 - 4 2018
P. 93
Työpoliittinen aikakauskirja 4/2018
Kuviot
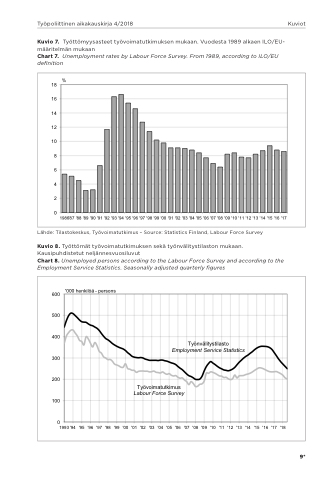
Kuvio 7. Työttömyysasteet työvoimatutkimuksen mukaan. Vuodesta 1989 alkaen ILO/EU- määritelmän mukaan
Chart 7. Unemployment rates by Labour Force Survey. From 1989, according to ILO/EU definition
18 %
16 18
14 16
12 14
10 12
8 10
68 46 24
02
1986'87 '88 '89 '90 '91 '92 '93 '94 '95 '96 '97 '98 '99 '00 '01 '02 '03 '04 '05 '06 '07 '08 '09 '10 '11 '12 '13 '14 '15 '16 '17
%
0
Lähde: TilastoKkuevsikou7s., Tyyöövtotöimayytusatksitmeeutsty–öSvouimrcaetu: tSktiamtuisktsicesnFminulaknaadn, .LVabuoduer sFtoar1c9e8S9uarvlkeayen
1986'87 '88 '89 '90 '91 '92 '93 '94 '95 '96 '97 '98 '99 '00 '01 '02 '03 '04 '05 '06 '07 '08 '09 '10 '11 '12 '13 '14 '15 '16 '17
ILO/EU-määritelmän mukaan
Kuvio 8. Työttömät työvoimatutkimuksen sekä työnvälitystilaston mukaan. ChKaurvtio7.7.UnTeymötptölomyymyesanst treaetet styböyvoLiambaoturtkFimoruckesSenurmveuyk.aFarno.mVu1o9d8e9s, tac1co9r8d9inaglktaoeInLO/EU
Kausipuhdistetut neljännesvuosiluvut
'000 henkilöä - persons
deILfinOit/iEoUn-määritelmän mukaan
Chart 8. Unemployed persons according to the Labour Force Survey and according to the Lähde: Tilastokeskus, Työvoimatutkimus - Source: Statistics Finland, Labour Force Survey
Chart 7. Unemployment rates by Labour Force Survey. From 1989, according to ILO/EU
Employment Service Statistics. Seasonally adjusted quarterly figures
definition
600 5
4
3
2 1
Lähde: Tilastokeskus, Työvoimatutkimus - Source: Statistics Finland, Labour Force Survey
600 '000 henkilöä - persons
00
500
00
400
00
300
00
200
00
100
0 1993
0
Eecs
Tvmm
aue
mp
T
loy
yön
men
välit
tS
ysti
rvi
last
eS
o
tati
stic
Työnvälitystila
Employment Service
sto
Statistics
L
yö
bo
oi
rF
atu
orc
tki
Su
us
rve
y
Työvo
Labour
ima
For
tutkimus
ce Survey
'94
'95
'96
'97
'98
'99
'00
'01
'02
'03
'04
'05
'06
'07
'08
'09
'10
'11
'12
'13
'14
'15
'16
'17
'18
Kuvio 8. Työttömät työvoimatutkimuksen sekä työnvälitystilaston mukaan.
1993'94 '95 '96 '97 '98 '99 '00 '01 '02 '03 '04 '05 '06 '07 '08 '09 '10 '11 '12 '13 '14 '15 '16 '17 '18
Kausipuhdistetut neljännesvuosiluvut
ChKaurvtio8.8.UnTeymötptölomyäetdtypöevrsooimnsatauctkciomrduiknsgetnostehkeäLtayböonuvrälFitoyrsctielaSstuornvemyuaknadana.ccording
toKthaeusEipmuphldoiysmteetunttnSeljrävnicnesSvtautoistiilcusv.uSt easonally adjusted quarterly figures
Chart 8. Unemployed persons according to the Labour Force Survey and according 9* to the Employment Service Statistics. Seasonally adjusted quarterly figures
